By Boima S. Kamara and Dehpue Y. Zuo
Introduction
The national budget is the instrument through which a government allocates resources with a view to, among others, uplifting underserved segment of the population, facilitating inclusive growth for shared prosperity, mitigating regional disparity, and enhancing the provision of basic social services. National budget is an instrument used to gauge the performance of any government (Robinson and Last, 2009; Jacob, Helis and Bouley, 2009).
A well-planned budget is of paramount importance for any government to ensure improved efficiency and effectiveness of public expenditures that engender economic stability and growth. As such, this article seeks to assess the Government of Liberia’s national budget performance over the 15 years spanning 2006 to 2020; highlight areas of focus, mainly recurrent and capital expenditures, and what needs to be done to strengthen sources of economic growth with emphasis on domestic resource mobilization (Jacobs, 2010).
Budgeting Process and Structure Since 2006
Liberia’s budgeting process goes through four cycles: preparation, approval, implementation, and evaluation, which are anchored on the constitutional mandate of the governing system. The Executive is responsible for preparation and implementation while the Legislature is solely responsible for approval and evaluation (PFM Law, 2009; Lienert, 2010). In 2006, the government inherited a budgeting system that lacked the capacity to link policy making, planning, and budgeting that reflect expenditure control to spur economic growth.
The Public Financial Management Act of 2009 provided robust framework for the management of budget and all national resources with clear roles and responsibilities for key branches of government. It clearly defines the budgeting process including borrowing, public debt and management of aid to Liberia. The PFM Law of 2009 also provided the legal basis for the eventual introduction in 2012 of the Medium-Term Expenditure Framework (MTEF) budgeting system, which links policy priorities to medium term expenditure for sustainable socioeconomic development and growth of the economy.
Budgetary Performance 2006 to 2020
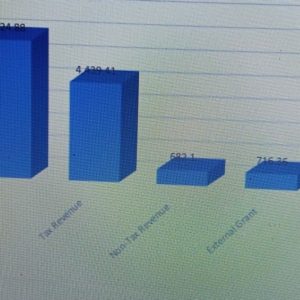
A thorough review of the various national budgets of the Government of Liberia published by the then Bureau of Budget, and now, Ministry of Finance and Development Planning (MFDP) was carried out. During the 15-year period, the size of the national budget moved from US$80.50 million in 2006 to US$535.63 million in 2020, amounting to a cumulative total of US$6.12 billion. Of the total revenue generated, tax revenue accounted for about US$4.44 billion (or 72.48%); non-tax revenue, US$0.68 billion (or 11.14%); external grant, US$0.72 billion (or 11.70%); and contingency, US$0.29 billion (4.69%).

It is important to point out that revenue performance of an economy is directly correlated to the level of economic activities underpinned by the level of political stability and openness of trade and investment. The higher economic growth is, the higher revenue generated will be. For the reviewed period, real GDP grew from a low of US$1.20 billion to around US$2.2 billion (nominally, around a high of US$3.30 billion). This growth was driven mainly by Liberia’s continued reliance on commodity exports, iron, rubber, and diamond; an economic model that continues up till now and explains why in 15 years as an economy, Liberia’s annual real GDP could not exceed more than US$2.5 billion.; showing up in revenue collected not being able to grow to US$700.00 million in 15 years (i.e., the size of the National Budget during the 15-year period never reached US$700.00 million including the current FY20/20 and associated medium term, MTEF’s forecasts).
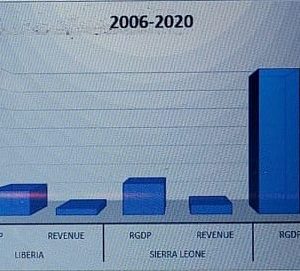
A comparison of Liberia’s performance with Sierra Leone[1] and Rwanda[2] for the same period shows that Real GDP in Rwanda grew from a low of US$5.93 billion to a highest of US$10.17 billion, averaging US$8.61 billion in real economic performance and US$1.63 billion on average in revenue performance; Sierra Leone, from a low of US$1,267.75 billion to a high of US$2,361.51 billion averaging US$1,764.48 billion in real GDP and averaging US$559.15 million; while, Liberia moved from a low of US$1.20 billion to a high of US$1.80 billion, averaging US$1.50 billion in real GDP and with an average of US$408.33 million in revenue collection for the same period.
[1] For Sierra Leone, the dataset was collected from IMF Country Reports 2006 to 2012; and Ministry of Finance of Sierra Leone Website Budget Profile FY12-16 and FY17-20. Fiscal data are indicative for comparison purpose as Liberian and Rwanda have the same fiscal-year period, while Sierra Leone’s fiscal year is on a calendar year basis.
[2] Dataset for Rwanda came from the National Institute of Statistics of Rwanda 2019 Publication on Macroeconomic Aggregates and the Ministry of Finance Annual Economic Review, FY2008-2019 and Annual Budget Execution 2005-2016.

It is good to point out that over the period of 15 years, Liberia’s economic activities generated a total of US$22.5 billion in real GDP with US$6.12 billion in revenue collection; Sierra Leone, US$28.23 billion and US$8.95 billion; and Rwanda, US$129.95 billion and US$24.39 billion, respectively. Rwanda outpaced both Liberia and Sierra Leone by more than 3 times in both real GDP and revenue generation. The difference lies mainly in significant public sector investments in roads and electricity as well as the diversification of the Rwandan economy. The data shows that of the total of US$6.12 billion revenue generated over the 15-year period, Liberia’s recurrent expenditure stood at US$5.68 billion and capital expenditure, US$0.56 billion[1]. During this same period, Rwanda invested US$6.39[2] billion, especially on electricity, roads, ICT and air transport; and at the same time received US$4.2 billion as international community support to capital projects through direct budget support.
The table below shows Liberia’s national budget by economic classification (FY05/06 to FY19/20):
Liberia: National Budget by Economic Classification (In Millions of US$)
| Total Revenue | 6,124.88 | % Share |
| Tax Revenue | 4,439.41 | 72.32 |
| Non-Tax Revenue | 682.10 | 11.20 |
| External Grants | 716.36 | 11.77 |
| Contingency (Loan/Cash b.Forward/Contingency Revenue) | 287.01 | 4.71 |
| Total Expenditure | 6,124.88 | |
| Compensation of Employees | 2,733.97 | 44.64 |
| Use of Goods and Services | 1,542.12 | 25.18 |
| Consumption of Fixed Capital | 560.80 | 9.16 |
| Interest and Other Charges | 35.07 | 0.06 |
| Subsidy and Transfers | 258.14 | 4.21 |
| Grants | 716.36 | 11.70 |
| Social Benefits | 12.30 | 0.20 |
| Non-Financial Assets | 90.24 | 1.47 |
| Domestic Liability | 115.26 | 1.88 |
| Foreign Liability | 60.62 | 0.99 |
Source: Authors’ computation based on national budgets data from 2005 to 2020
In concluding and recommending, we wish to point out the following:
Liberia’s growth was driven by political stability characterized by confidence in governance, trade, and investment. The revenue side of the budget shows that in 15 years, revenue generation did not climb to US$700 million; averaging U$408.33 million.
The expenditure side of the national budget during the period shows that compensation of employees and goods and services accounted for about 70% of public expenditures with 45% and 25%, respectively. It is interesting to note that less than 10% of the expenditures went into consumption of fixed capital, the fulcrum of capital investment that could accelerate growth of the economy; less than the international community support through external grant expenditures of 716.4 million or 11.70 percent.
Economic diversification with intentional investments in roads, electricity, ICT, and human capital transformation will be the surest way to widening the tax base. It is important to note that improving domestic assets accumulation will help to spur growth in domestic revenue mobilization.
We must challenge ourselves to think outside of the box. The current 3-year Medium Term Expenditure Forecast (MTEF) prepared by the Ministry of Finance and Development Planning (MFDP) as reflected in the FY2020/21 national budget indicates revenue generation will not rise above US$600 million, This would mean the following: a stagnation in commodity-export growth for the last 5 years as a reliance for domestic revenue generation; being trapped for the next 3 years with low revenue capacity to meet growing expenditure pressures; and being poorer as nation relative to 15 years ago when adjusting for inflation given a rapid rise in inflation accompanied by slow growth in revenue not equaling or exceeding US$700 million.
Remaining on track with a Liberia-IMF ECF Program is a necessary condition to advance us towards our developmental goals, but it is not sufficient[3] as a stand-alone policy. To achieve our development goals, the Government will have to also ensure good governance, improved business-investment climate, transparency and accountability on one hand as the soft-side, low-hanging fruits; and, on the other hand, strategic material investments in roads, power, and human capital transformation as the hard side to do the heavy lifting of economic transformation.
References:
Jacobs, Davina F. (2008), A Review of Capital Budgeting Practices, IMF Working Paper, WP/08/160. Retrieved from https://www.imf.org/en/Publications/WP/Issues/2016/12/31/A-Review-of-Capital-Budgeting-Practices-22076
Lienert, Ian (2010), The Role of the Legislature in Budget Process, IMF Technical Notes. Retrieved from https://www.imf.org/en/Publications/TNM/Issues/2016/12/31/Role-of-the-Legislature-in-Budget-Processes-23722
Jacobs, Helis and Bouley (2009), Budget Classification, IMF Technical Notes. Retrieved from https://www.imf.org/en/Publications/TNM/Issues/2016/12/31/Budget-Classification-23470
Robinson and Last, (2009), A Basic Model of Performance-Based Budgeting, IMF Technical Notes and Manual. Retrieved from https://www.imf.org/en/Publications/TNM/Issues/2016/12/31/A-Basic-Model-of-Performance-Based-Budgeting-23247
Republic of Liberia, (2009) Public Financial Management Act of 2009. Retrieved from https://www.moci.gov.lr/doc/Public%20Finance%20Management%20Act.pdf
Republic of Liberia, (2014-2020), National Budget, Government of the Republic of Liberia. Retrieved from https://www.mfdp.gov.lr/index.php/docs/the-national-budget
[1] The introduction of Public Sector Investment Project (PSIP) as a capital expenditure line item started during FY11/12 fiscal year. Before this time, capital expenditure as a line item was ambiguous; sometimes you will see” capital investment” and another time, “consumption of fixed capital” under expenditure by Economic Classification.
[2] For Rwanda, the national budgets from 2006 to 2020 clearly captured CAPEX, totaling US$6.39 billion
[3] The June 1, 2020 GoL Letter of Intent (LOI) to the IMF asserts an ECF Program as a sufficient condition

